diggrdata_FromSoftware
This site augments my publications on the spatialization of videogame production, distribution and reception in the case of the Japanese company FromSoftware. This research is currently published or accepted for publication as follows:
- Roth, Martin (ロート マーティン). Accepted, 2021. テレビゲーム文化の空間的展開:FromSoftwareゲームの生産的・流通的展開とそれにおけるソフトな文化的境界線. Replaying Japan, Vol. 3.
The site features interactive and non-interactive visualizations used for or resulting from my analysis of the data stored in the diggrdata_FromSoftware repository. For more information, see the README. The data is used in my ongoing research project on videogame spatialization, and will be updated and extended over time. For stable versions used in my research, please refer to the Zenodo snapshot specified in the respective research output.
1. FromSoftware Production
1.1. FromSoftware Collaborators per game per country
The following figures provide an overview of the companies involved in the production of FromSoftware games, based on datasets 1. FromSoftware DataTable and 2. FromSoftware Production Network based on Mobygames Release Data. Click on the image for a higher resolution version.
1.2. FromSoftware Production Network based on Mobygames Release Data
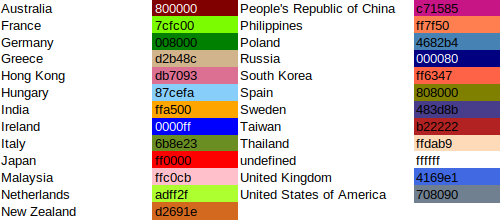
The following figures depict the production networks of companies involved in FromSoftware games according to the release data on Mobygames.com, based on the dataset 2. FromSoftware Production Network nodelist and edgelist. Edges are based on contribution to the same game (collaboration network). Nodes are defined for each company in each distinct role it takes on. Company location was added where available via Wikidata. The data was created with diggr lemongrab and edited manually in Gephi 0.9.2 to add statistical data, as well as to include several country data missing on Wikidata and a country based color hex code, following this color schema:

The following network visualization shows all actors, meaning any companies in any role involved in producing a FromSoftware game.
The following network visualization excludes the actors who take on functions needed when publishing a game outside of Japan, such as “localization.”
2. FromSoftware Distribution
2.1. Distribution Overview
The following visualizations show the historical change in the regional distribution of FromSoftware games. They are based on the dataset 1. FromSoftware DataTable and 3. FromSoftware Release Data.
Number of releases per region per game
First release region distribution
Temporal distance between first release in Japan and first release in US and EU
2.2. Release Timeline
The following link takes you to an interactive visualization of all available FromSoftware game releases in Japan (JP), Europe (EU) and North America (US) mapped on a timeline with various additional information about each game. The visualization was created with diggr tulpa. Provenance information is available, added with diggr provit.
Meta
License
CC-BY 4.0

Copyright 2021 Martin Roth research@asobiba.de